Albireo Energy PLUGGED IN is a news channel for our energy analysis and procurement customers, providing a monthly view into energy markets. We highlight key trends, pricing dynamics, and procurement insights to help you stay informed and make smarter energy decisions.

NYC Building Performance in First Emissions Compliance Year
Local Law 97 (LL97) was passed in 2019 as a multi-year plan to bring New York City’s buildings over 25,000 square feet to net zero emissions by 2050. 2024 marked the beginning of the first compliance period. Buildings were required to file their 2024 in 2025 and now NYC has issued a report detailing the performance. The initial year saw 95% of properties filing submissions, and only 5% of those properties were above emissions limits.
Buildings are grouped into Article 320 for market-rate buildings and Article 321 for affordable housing properties. Auditing of the Article 321 submissions are still underway, so reporting for those properties are not as complete as for the Article 320 properties. Article 320 encompasses 16,862 buildings organized into 11,036 properties, and Article 321 has 12,169 buildings in 8,927 properties for a city wide total of 29,031 buildings on 19,963 properties.
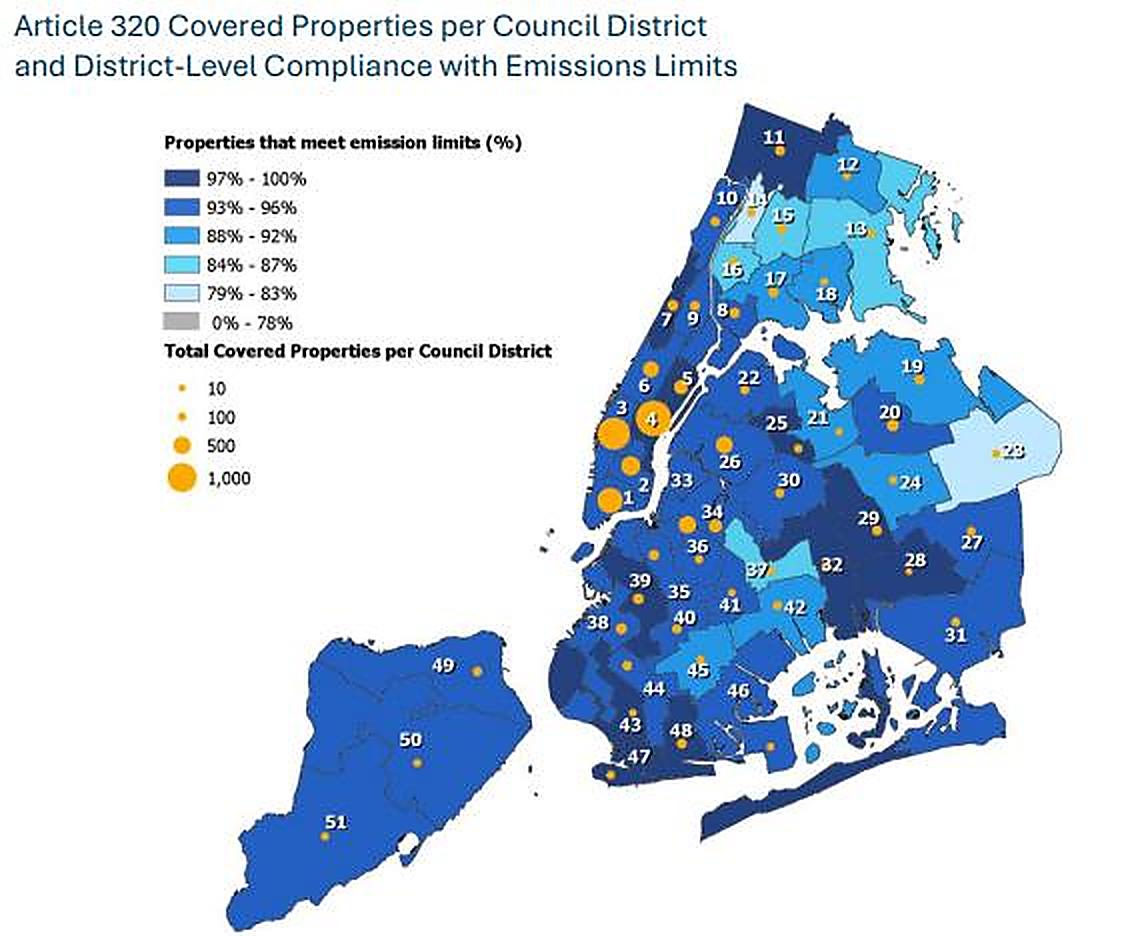
Source | Local Law 97: 2024 Compliance and Reporting Rates
For Article 320 properties, all the boroughs had filing rates above 90% except Staten Island at 84%. Manhattan led the way with 98%. All boroughs had emissions compliance rates above 90% besides the Bronx, which is at 89%. Again, Manhattan topped the boroughs with 95% compliance. For 321 properties, all boroughs had filing rates above 90% with Queens being the exception at 89%. Staten Island was perfect at 100%. Compliance wasn’t reported by borough. The city-wide compliance was 76%.
There are several avenues properties can take to reduce their calculated emissions to avoid penalties. Some examples include installing distributed energy resources like rooftop solar, replacing fossil fuel powered systems with high efficiency electric systems, or purchasing carbon offsets and renewable energy credits (RECs).
ISONE and PJM Capacity News
Both ISO New England (ISONE) and PJM are attempting to address rising capacity needs. ISONE recently released two new mapping tools. The first is a heat map designed to identify areas available for new generation projects based on available capacity on transmission lines. It also takes into account the new ISONE cluster study approach to interconnection studies. The second provides information regarding new approved generation projects by fuel source and operational dates. These mapping tools are in FERC Commission Order No. 2023.
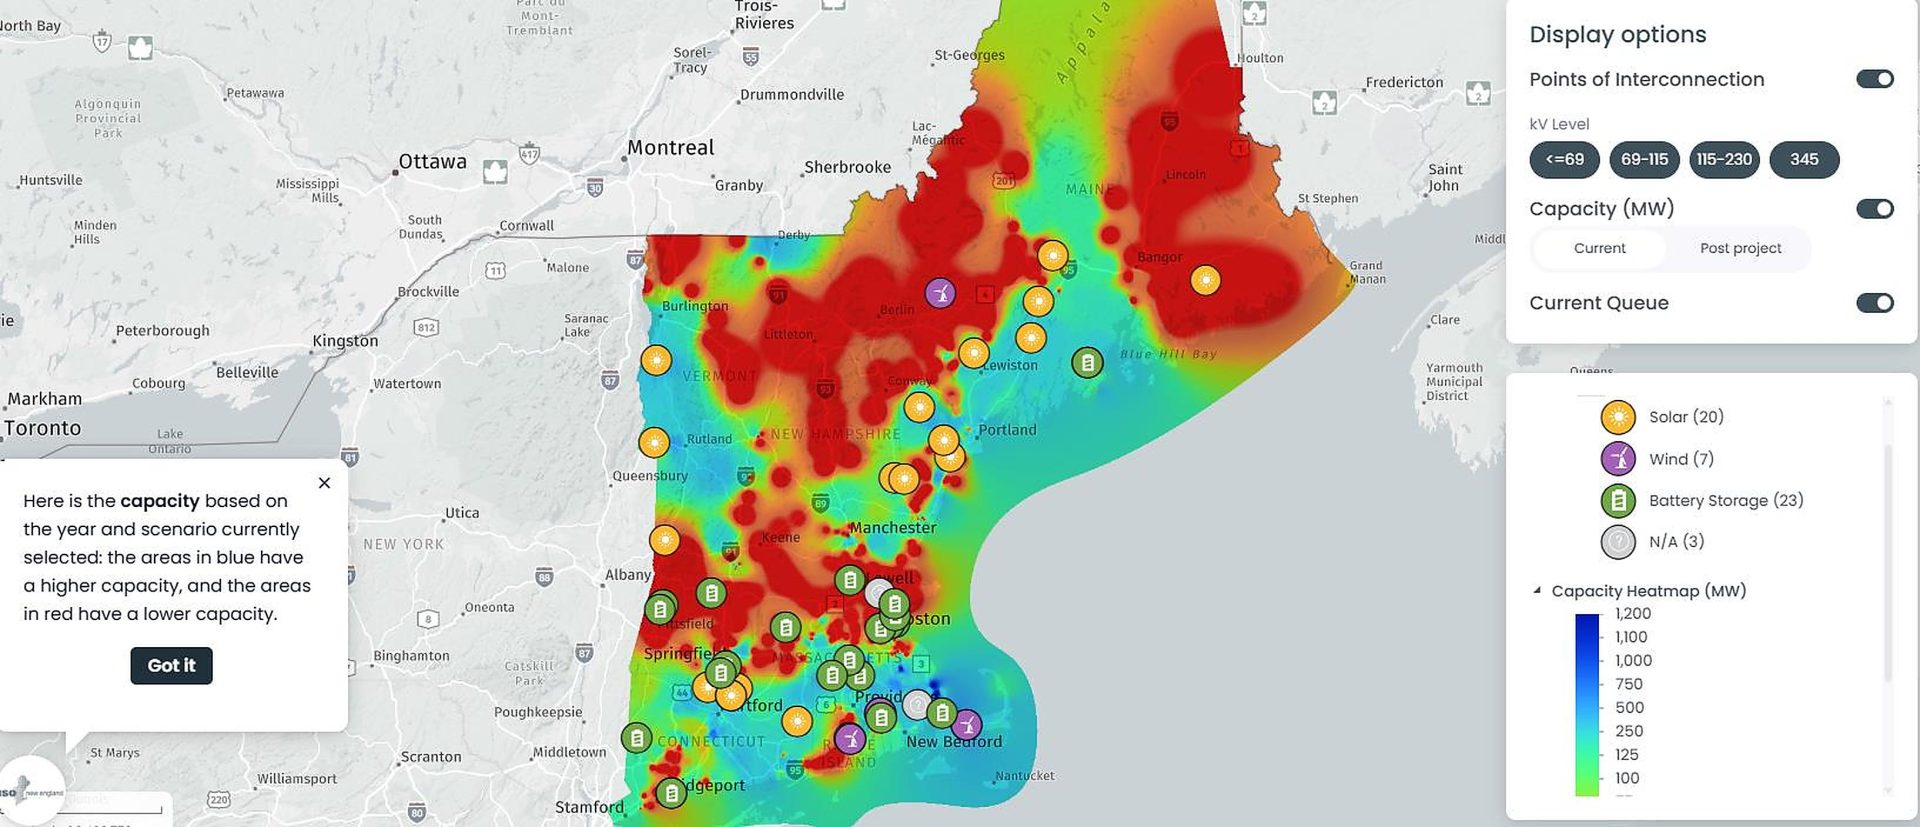
Source | ISONE Heatmap – POI Analysis Map

Source | ISONE Queue Map
Meanwhile, PJM announced that 617 projects entered Phase I of their new interconnection process. These projects total 169 GW of nameplate capacity. There were 811 initial project applications which reduced to 715 that entered the Cycle before landing on 617 that have passed into Phase I. The goal of the new process is to improve predictability of projects reaching completion by reducing the number of speculative projects. PJM currently has 49 GW of generation with signed agreements that are not being built or are delayed by state permitting hurdles or supply chain backlogs.
PJM Initiates Annual Vetting of Large Load Requests
On August 3rd Texas Governor Greg Abbott paused all new data center connections until the impact they are having on the power grid and water consumption could be assessed. The growth of data centerOn September 29th, the PJM Load Analysis Subcommittee received proposals from twelve utilities for requests by Large Loads users in their service areas. These Large Loads are typically data centers or crypto operations. This year will mark the first time that PJM will include analysis from Charles River Associates concerning industry trends for data centers. The analysis includes such factors as AI adoption and digital economy as well as constraints posed by supply chain issues and availability of power.
PJM standardized the submission process this year across all utilities to include additional factors which PJM needs to assess requests. Near-term requests will require firm commitments including items like a construction commitment. Longer-term projects with greater uncertainty will be considered non-firm and not subject to the same requirements.
Ultimately, these findings will be reported in the PJM 2027 Long-Term Load Forecast which will be released in January 2027. Since PJM will need to make investments in new generation and transmission infrastructure to serve the growing number of Large Loads, it is important that an accurate assessment is made about the likelihood of projects coming online as well as when and how their usage will ramp.

Market Update
Natural Gas storage numbers remain strong as calendar 2027 continues to drift lower. Cal 2028 and 2029 have both flattened out. Electricity prices continue their upward trajectory for most markets as they fear tightening supply reserves and a return of last year’s winter storm activity.


Contact Customer Service at email: [email protected], phone: 855.521.8780, or through our online portal.
Reminder, it is budget season and with winter pricing looming it is important for early review of budgets for 2027. Please reach out to your contact or customer service at [email protected] to request your 2027 budget.